本文主要记录《Sklearn与TensorFlow 机器学习实用指南》中的理论知识拓展和实践问题中解决方案的总结
大纲
1.项目概述
- 核心问题:利用街区组数据(人口、收入中位数、房价中位数等)预测任何街区的房价中位数
- 划分问题:划定问题类型,监督/非监督/强化学习,分类/回归,批量学习/线上学习,明显这是个监督(有标签)回归(预测值)批量学习(没有连续数据流入)问题
- 性能指标:回归问题典型的性能指标是均方根误差(RMSE),均方根误差是系统预测误差的标准差,满足高斯分布,即满足 “68-95-99.7”规则:大约68%的值落在1σ内,95% 的值落在2σ内,99.7%的值落在3σ内。

虽然大多数时候RMSE是回归任务可靠的性能指标,在有些情况下,你可能需要另外的函数。例如,假设存在许多异常的街区。此时,你可能需要使用平均绝对误差(Mean Absolute Error,也称作平均绝对偏差)
其实RMSE和MAE仅仅是测量预测值和目标值向量距离方法不同,MAE使用的是l1范数(曼哈顿距离),RMSE使用的是l2范数(欧几里得距离),更一般的有lk范数(K 阶闵氏范数)
范数的指数越高,就越关注大的值而忽略小的值。这就是为什么RMSE比MAE对异常值更敏感。但是当异常值是指数分布的(类似正态曲线)RMSE就会表现很好。
2.获取数据
创建工作空间:安装python-更新pip版本-安装jupyter matplotlib numpy pandas scipy scikit-learn库
打开Jupyter:命令[jupyter notebook]打开http://localhost:8888/可以看到工作空间,点击New创建新的notebook文件[.ipynb]文件,之后可以在底下代码框放入可执行代码或者格式化文本,点击运行按钮,会将当前代码框发送到python内核运行之后返回输出结果显示在代码框下方
获取数据:使用以下代码可以通过urllib库发起网络请求下载housing.tgz文件并解压出数据文件housing.csv1
2
3
4
5
6
7
8
9
10
11
12
13
14
15
16
17
18
19
20import os
import tarfile
from six.moves import urllib
DOWNLOAD_ROOT = "https://raw.githubusercontent.com/ageron/handson-ml/master/"
HOUSING_PATH = "datasets/housing"
HOUSING_URL = DOWNLOAD_ROOT + HOUSING_PATH + "/housing.tgz"
def fetch_housing_data(housing_url=HOUSING_URL, housing_path=HOUSING_PATH):
if not os.path.isdir(housing_path):
os.makedirs(housing_path)
tgz_path = os.path.join(housing_path, "housing.tgz")
urllib.request.urlretrieve(housing_url, tgz_path)
housing_tgz = tarfile.open(tgz_path)
housing_tgz.extractall(path=housing_path)
housing_tgz.close()
if __name__ == '__main__':
fetch_housing_data()
3.加载、查看、分析数据
加载数据显示数据属性:使用pandas库的read_csv()函数读取csv数据文件(我将数据文件移到与py文件同一目录下了)1
2
3
4
5
6
7
8
9
10
11import pandas as pd
if __name__ == '__main__':
# 读取scv数据文件 返回包含所有数据的Pandas的DataFrame对象
housing=pd.read_csv("housing.csv")
# DataFrame对象的head()方法查看数据集前五行
print(housing.head())
# value_counts()方法查看项中有哪些类别
print(housing["ocean_proximity"].value_counts())
# describe()方法查看数值属性的概括
print(housing.describe())
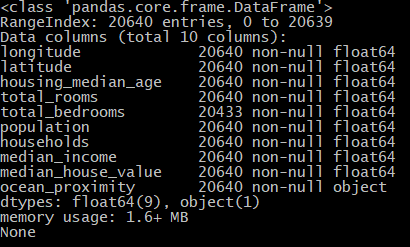

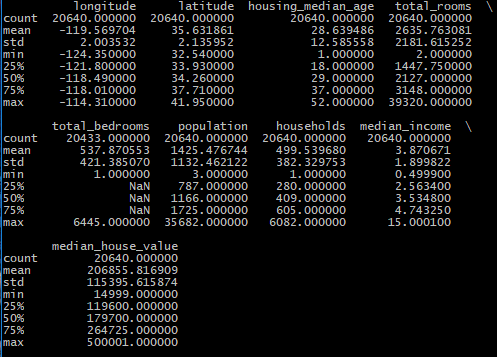
柱状图显示数据:对完整数据集调用hist()方法查看每个特征的柱状图
1 | import matplotlib.pyplot as plt |
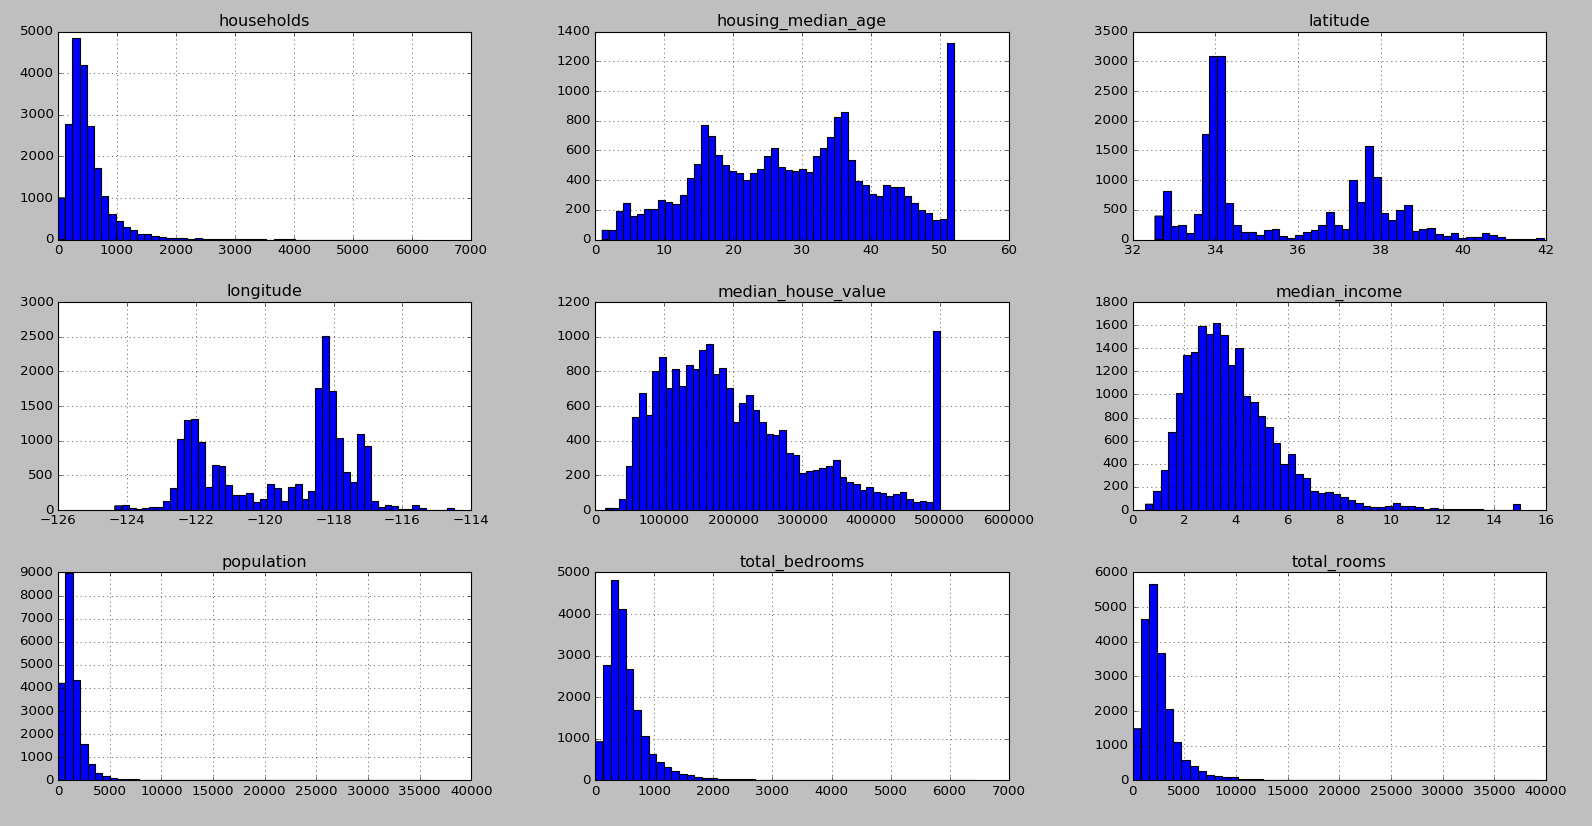
分析数据:
1.翘尾现象:housing_median_age和median_house_value数据存在翘尾现象,可能是中位数被设置了上限或者数据集是被截断的数据集,median_house_value作为本次预测的目标值由于翘尾现象可能构建的预测模型无法超过这个上限值,一般有两种解决方案:将翘尾标签重新收集或者移除
2.长尾分布:可以看到households、population、total_bedrooms和total_rooms数据存在长尾分布现象,我们应当尝试变换处理属性,使其满足正态分布(钟型分布)
### 4.数据可视化
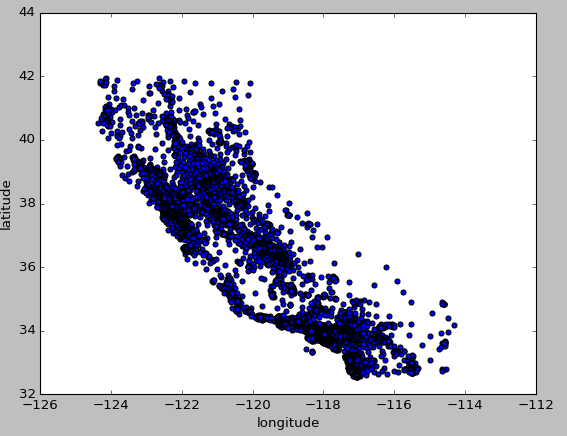
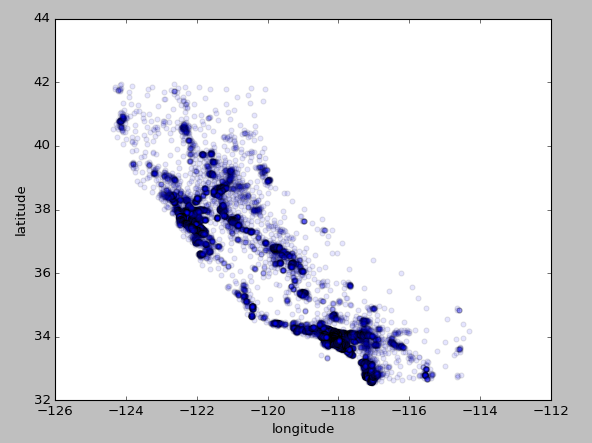
地理数据可视化:由于存在经纬度,可以试着创建所有街区的散点图
1 | import matplotlib.pyplot as plt |
1 | # 将alpha设为0.1观察数据点密度 |
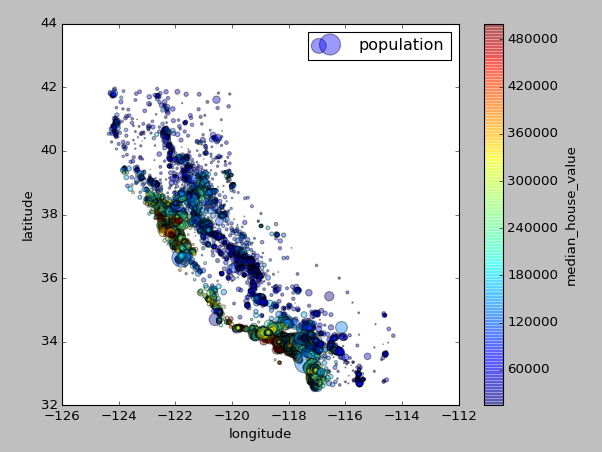
地理数据+人口+价格可视化:使用每个圈的半径表示街区的人口(选项s),颜色代表价格(选项c)
1 | housing.plot(kind="scatter", x="longitude", y="latitude", alpha=0.4, |
5.查找关联
6.切割数据集
1.第一种方法:设置随机数生成器种子,生成shuffled_indices洗牌指数(数据index打乱处理),之后切割洗牌指数,最后根据洗牌指数中的数据index用data.iloc[]根据数据索引位置对数据集进行切片处理,其他切片处理方法可见这里1
2
3
4
5
6
7
8
9
10
11
12
13
14
15
16
17
18
19
20
21
22
23
24import numpy as np
def split_train_test(data, test_ratio):
# 设置随机数种子
np.random.seed(42)
# shuffled_indices洗牌指数 将所有数据的index打乱重排
shuffled_indices = np.random.permutation(len(data))
# 测试集大小
test_set_size = int(len(data) * test_ratio)
# 切割数据集 前面test_ratio数量数据为测试数据集的index
test_indices = shuffled_indices[:test_set_size]
# 后面数据为训练数据集的index
train_indices = shuffled_indices[test_set_size:]
# data.iloc[]用于根据索引位置对数据集进行切片
return data.iloc[train_indices], data.iloc[test_indices]
if __name__ == '__main__':
# 读取scv数据文件 返回包含所有数据的Pandas的DataFrame对象
housing=pd.read_csv("housing.csv")
# 切分数据集1
train_set, test_set = split_train_test(housing, 0.2)
# 训练集、测试集信息
print(train_set.info())
print(test_set.info())
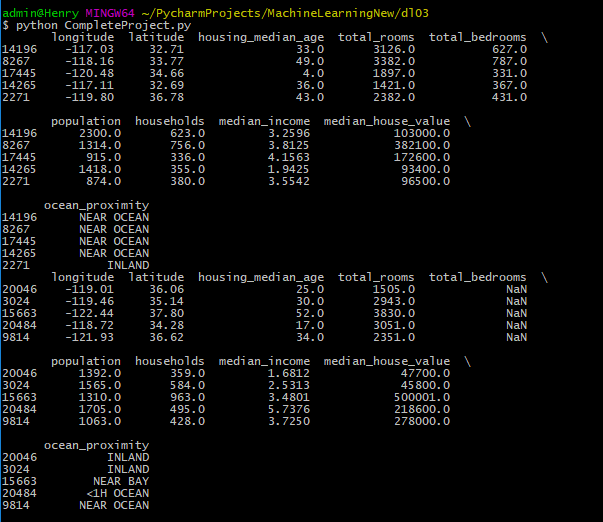
可以看到切分的训练集有16512行数据,测试集有4128行数据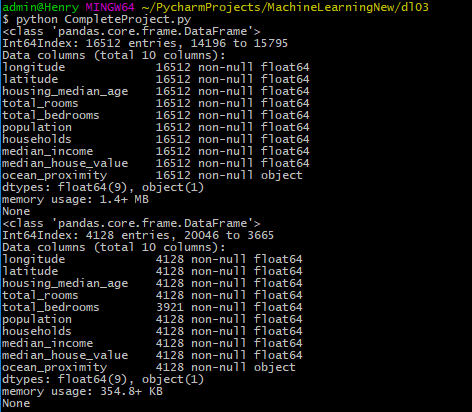
可以看到即便多次运行训练集和测试集所选数据的index还是相同的,因为我们设置了相同的随机数种子
2.第二种方法:第一种方法的缺点是数据集更新则切割得到的数据集会改变,通常解决方法根据每个实例的ID来判断这个实例是否应该放入测试集,如计算ID哈希值保留最后一个字节,若字节小于51(256的20%)则将其放入测试集,这样即使更新了数据集或者多次运行,新的测试集依旧包含新实例的20%且不会改变旧的测试集的划分1
2
3
4
5
6
7
8
9
10
11
12
13
14
15
16
17
18
19
20
21
22
23
24
25
26
27
28
29import hashlib
# 计算hash值
def test_set_check(identifier, test_ratio, hash):
return hash(np.int64(identifier)).digest()[-1] < 256 * test_ratio
# 根据传入的id_column索引划分数据集
def split_train_test_by_id(data, test_ratio, id_column, hash=hashlib.md5):
ids = data[id_column]
in_test_set = ids.apply(lambda id_: test_set_check(id_, test_ratio, hash))
return data.loc[~in_test_set], data.loc[in_test_set]
if __name__ == '__main__':
# 读取scv数据文件 返回包含所有数据的Pandas的DataFrame对象
housing=pd.read_csv("housing.csv")
# 划分数据集2
# reset_index()还原索引成整形索引 set_index()设置索引字段
housing_with_id = housing.reset_index()
# 根据行索引切分数据集
train_set, test_set = split_train_test_by_id(housing_with_id, 0.2, "index")
# 根据行索引划分需要保证新数据放在源数据尾部且不能删除数据
# 可以用其他稳定的特征来创建唯一识别码 如使用维度+经度
housing_with_id["id"] = housing["longitude"] * 1000 + housing["latitude"]
# 根据经纬度划分数据集
train_set, test_set = split_train_test_by_id(housing_with_id, 0.2, "id")
# 训练集、测试集信息
print(train_set.head())
print(test_set.head())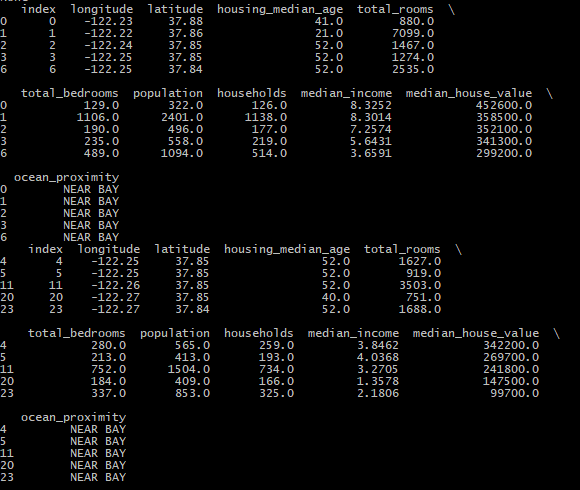
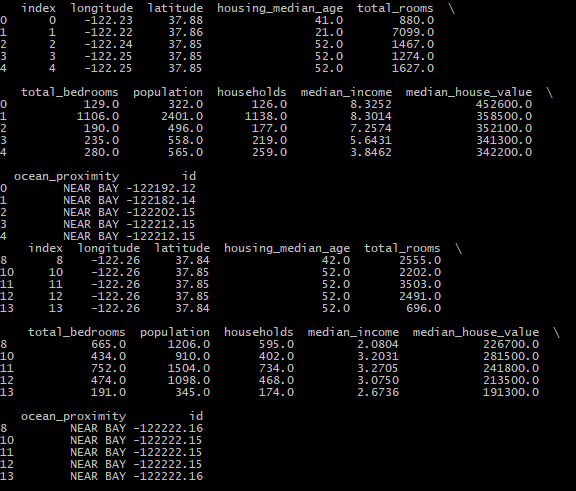
3.第三种方法:Scikit-Learn提供的train_test_split(data,test_size,random_state)函数,使用这个函数的好处是可以设置random_state,将种子传递给多个行数相同的数据集,可以在相同的索引上分割数据集,比如标签和特征不在同一个DataFrame1
2
3
4
5
6
7
8
9from sklearn.model_selection import train_test_split
if __name__ == '__main__':
# 读取scv数据文件 返回包含所有数据的Pandas的DataFrame对象
housing=pd.read_csv("housing.csv")
# 划分数据集3
train_set, test_set = train_test_split(housing, test_size=0.2, random_state=42)
print(train_set.head())
print(test_set.head())